California schools continued to make incremental gains in graduation rates, chronic absenteeism, academic achievement and college readiness, according to the California School Dashboard released Thursday.
But it’s not all good news. Despite gains, many schools are still struggling with high levels of chronic absenteeism, and while state test scores have improved, they are still below pre-pandemic levels.
“Seeing modest improvement on every Dashboard indicator should encourage us to deepen our investments in every child’s progress,” said State Superintendent of Public Instruction Tony Thurmond in a statement. “We can see that strategies like community schools and literacy coaches are making a positive impact for the whole child.”
The 2025 dashboard, released by the California Department of Education, uses student data to measure academic performance, chronic absenteeism, college and career readiness, English learner progress, and graduation and suspension rates.
Performance is based on the current year’s results and on whether results improved from the prior year, according to the CDE.
Color-coded graphics indicate whether a school or district has improved or declined in each area. Blue indicates the best performance, followed by green, yellow, orange, and then red. Schools or county offices with a red rating are referred to their county offices of education for assistance.
The number of California school districts performing low enough to be eligible for support from their county offices has declined for the third year in a row. This year, 418 districts qualified for help, compared with 436 last year.
This was the first time in the eight-year history of the dashboard that all statewide indicators are yellow or green, meaning fewer school districts are in need of improvement.
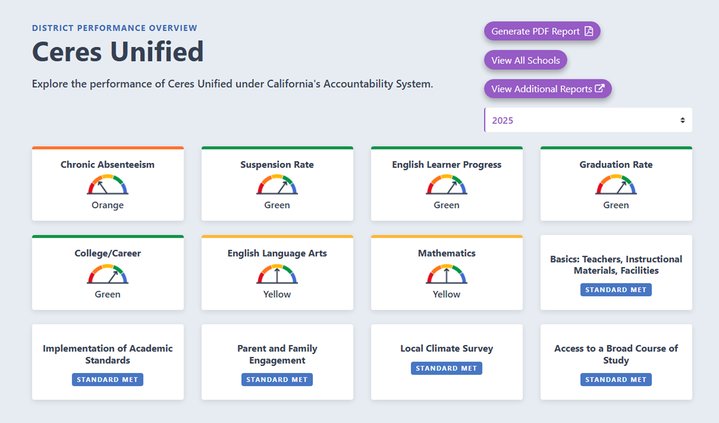
CUSD sees mixed results
Locally, Ceres Unified School District saw increases in academic performance improvement. English Language Arts saw an increase is 9.2 points but still 33.4 points below the state standard; and Mathematics performance increased by 6.9 points while being 77 points below standard to land in the yellow section of the dashboard.
CUSD was “green” in English Learner Progress with 46.5 percent of students making progress. Likewise, in College/career prep, CUSD saw an increase of 3.6 percent with 42.7 percent of high schoolers being prepared.
“We are incredibly proud of the academic progress reflected in this year’s California School Dashboard,” said CUSD Supt. Dr. Amy Peterman. “Our 9.2-point gain in English Language Arts and 6.9-point gain in math represent our strongest growth since before the pandemic, alongside notable increases in English Learner Progress and College and Career Readiness.”
Ceres is not doing so well with a slight increase of 0.5 percent in chronic absenteeism, showing 15.2 percent of students are chronically absent from school.
On a more positive side, CUSD saw a 92.9 percent graduation rate among 12th graders, a slight increase of a half percent.
Ceres’ suspension rate remained in the green with 1.7 percent of students suspended at least one day during the school year.
“Our graduation rate remains strong at 92.9 percent, and our suspension rate has dropped again to just 1.7 percent — a testament to the thoughtful, student-centered work happening every day in our classrooms,” Peterman said. “While chronic absenteeism increased slightly by 0.5 percent, it has improved by 16 percent overall since students returned to full-time instruction (2021-22). This progress reflects our continuing districtwide focus on strategies that help all students attend school regularly and access the supports available to them. Overall, this Dashboard provides many reasons to celebrate, and our students, families, staff, and leaders should be very proud.”
CUSD has an enrollment of 13,161, of which 86.9 percent come from socioeconomically disadvantaged households and 30.8 percent are English learners.
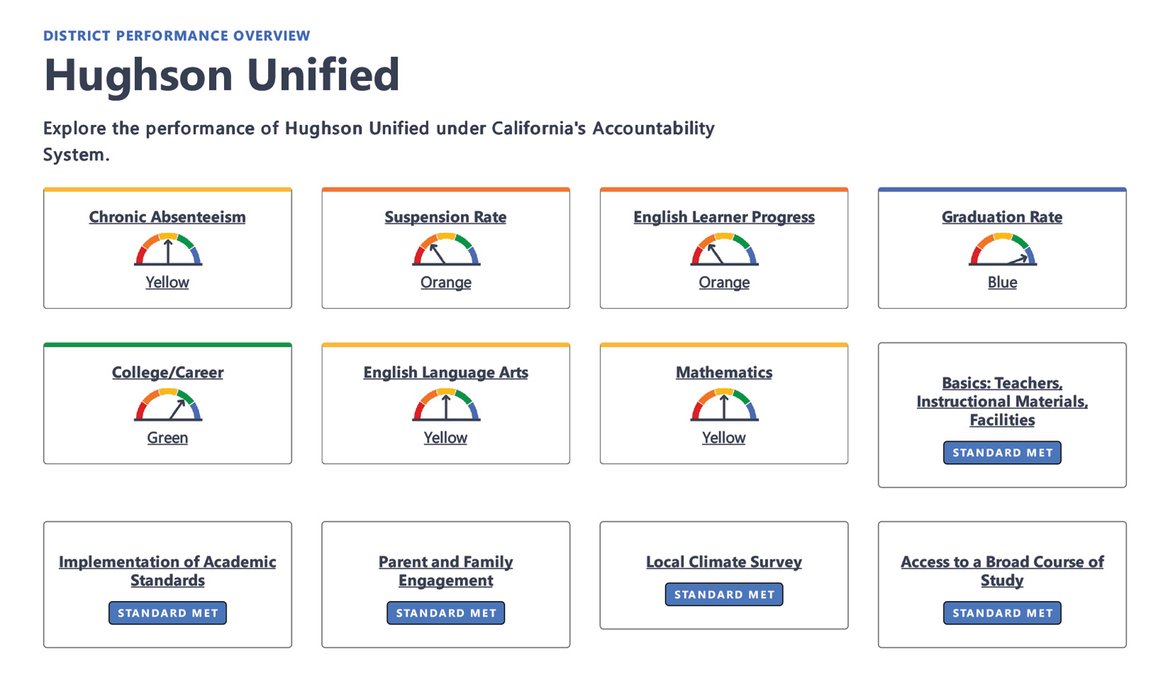
Hughson Unified recorded a 1.1% decline in chronic absenteeism and a 2.5% increase in graduation rate, but also a 0.7% increase in suspension rate. Hughson saw a 12 points increase in English Language Arts and 8.2 points increase in mathematics, with a 3.8% decline in English Learner Progress and maintained an average score in science at 46.5 points. Hughson also recorded a 3.7% increase in college/career readiness.
Not all students are succeeding
But a deeper look at individual school districts and schools shows that many are still struggling. The student groups in most need of support at traditional public schools and charter schools are students with disabilities, socioeconomically disadvantaged students, English learners and homeless students, according to the CDE.
California School Boards Association CEO and Executive Director Vernon M. Billy said state leaders are celebrating minimal progress while there are still persistent gaps in academic achievement and other outcomes, depending on student family income, race and ZIP code. He is calling for a statewide plan to support schools and accelerate student performance.
“While incremental gains are welcome, they cannot obscure the basic facts — our academic performance is not improving fast enough to meet the needs of California or those of its 5.8 million students,” Billy said.
Chronic absenteeism
Improvements in chronic absenteeism, which the dashboard tracks from transitional kindergarten to eighth grade, seem to be slowing. Absenteeism rates last year dropped only 1%, to 19.4%, after two years of larger drops. In 2021-22, chronic absenteeism rates peaked at 30%.
Students are considered chronically absent if they miss 10% or more of the school year for either excused or unexcused reasons.
The problem persists among some student groups, including foster and homeless students — at about 31% each. Rates for Pacific Islander, Black and Native American students hovered mostly around 30%.
Districts like Saratoga Union outside of San Jose decreased chronic absences across every student group after increases in previous school years.
Constant communication among staff, data collection and analysis, and early engagement with families are at the center of the Santa Clara County district’s strategy that reduced chronic absenteeism to 5%, according to Moira Barker, assistant superintendent of educational services. The 1,600-student district’s four principals meet weekly to analyze chronic absence data from each school site and share strategies for reengaging students.
Last year, after chronic absences rose to 8%, Saratoga Union formed a committee that developed protocols to address absences before they became chronic. Their district-level data showed more cases of students refusing to attend school than in previous years, in part due to mental health challenges.
“One of the things they learned is actually getting involved as soon as possible — the longer a student refuses to come back, the more difficult it is to get them to reengage in school,” Barker said.
Torrance Unified’s slight increase of 0.6% to 8.6% in chronic absenteeism was enough to change its state dashboard indicator from green to orange.
This school year, the 22,000-student district in Southern California has started a new notification process to communicate directly with parents about their students’ attendance, according to Sara Baillie, director of communications for Torrance Unified.
Highest per-pupil state funding ever
The dashboard had a few changes this year, including officially adding science scores from standardized tests as an indicator of whether schools need support and adding Advanced Placement courses to the college/career indicator.
A press release from the California Department of Education attributes the gains made by school districts to state investments in K-12 education, including transitional kindergarten and accelerated learning.
The 2024 California state budget set aside $133.8 billion for K–12 education, which was the highest per-pupil state funding ever for California students, according to the CDE.
This year’s budget added $215 million to the Literacy Coaches and Reading Specialists Grant Program to help students who need literacy support.
“The more we can invest time, energy, and resources into our kids, the better their future can be,” said Gov. Gavin Newsom in a statement.
Contributing to this report was Jeff Benziger and Diana Lambert, Betty Marquez Rosales and Daniel J. Willis is EdSource.